Table of contents
Introduction
There're two ways of doing that: launch a new process or attach to an existing one. Both of those methods lead to the same result, but in different ways. Before going further, make sure you have Debugger for Chrome extension installed in you VSCode editor. If you haven't worked with VSCode debugger before, you can quickly familiarize your self with it by reading initial setup section or by using the official guide.
Initial setup
VSCode debugger keeps the configuration in the
launch.json file under .vscode folder:
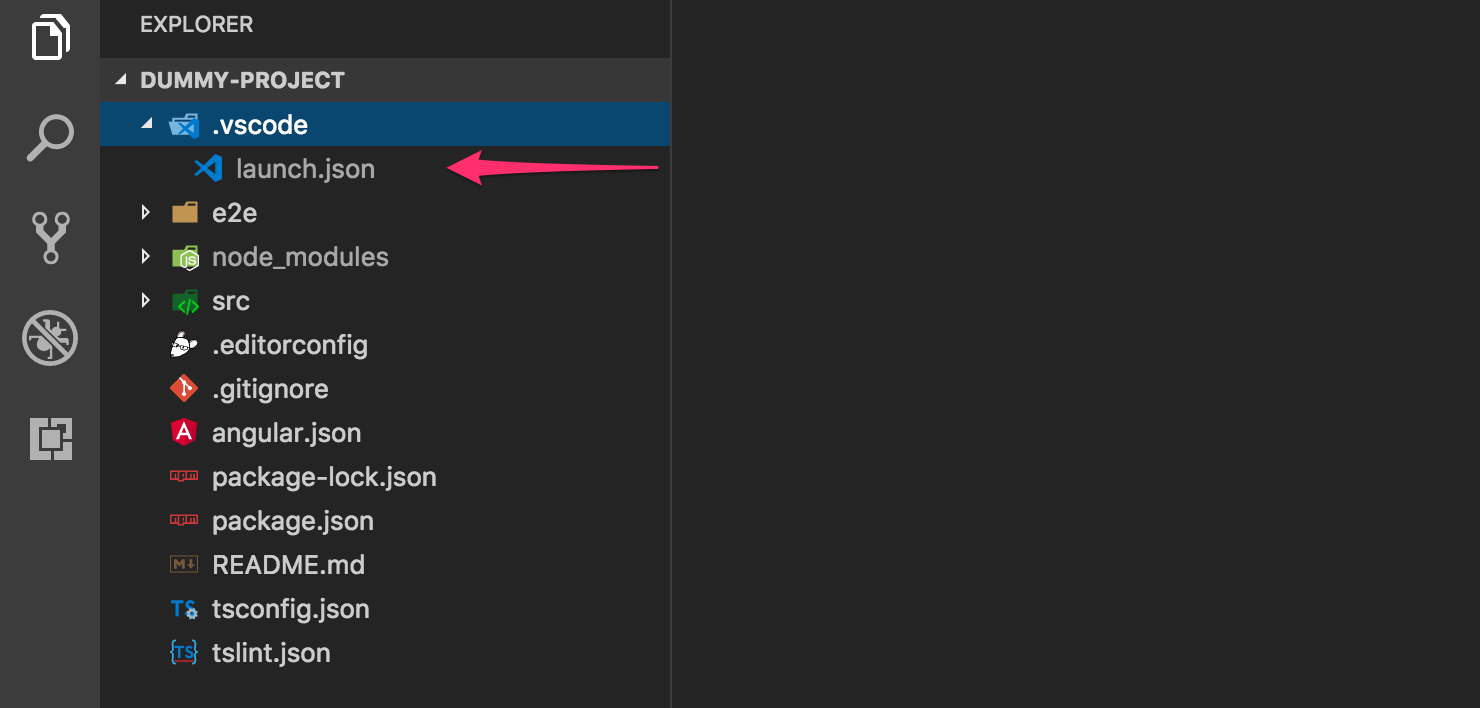
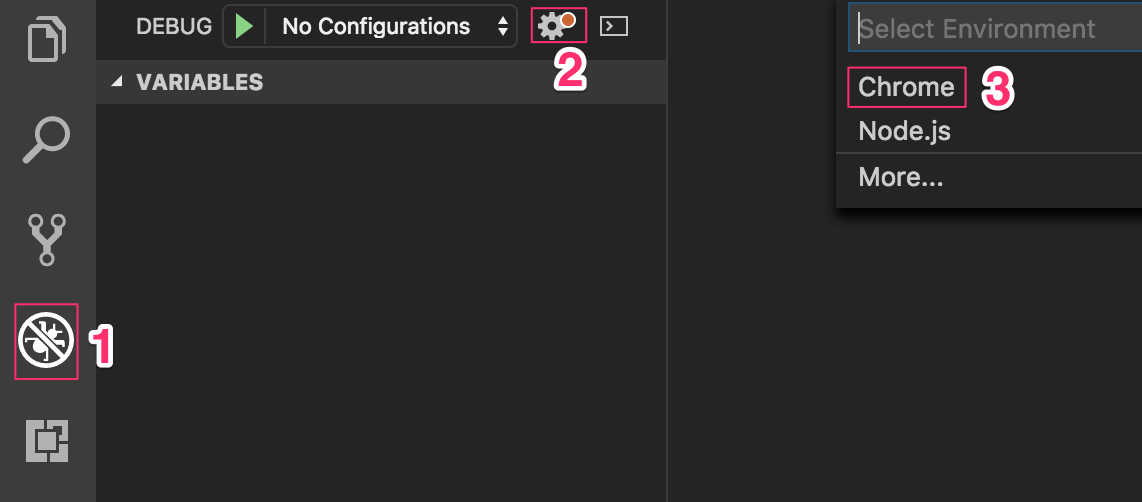
However, this file is not created by default. You can manually create it or allow VSCode do this automatically by doing following series of steps as illustrated in the following picture:
At the end of this section, you should have launch.json
with some configuration that VSCode inserted by default.
Launch the process
This is a most straightforward instruction which you find in many tutorials.
- First of all, you need to create or change
launch.json:
{
  "version": "0.2.0",
  "configurations": [
    {
      "name": "Angular debugging session",
      "type": "chrome",
      "request": "launch",
      "url": "http://localhost:4200",
      "webRoot": "${workspaceFolder}"
    }
  ]
}- As a next step, in the terminal run Angular (or to be precise Webpack) local web server by executing:
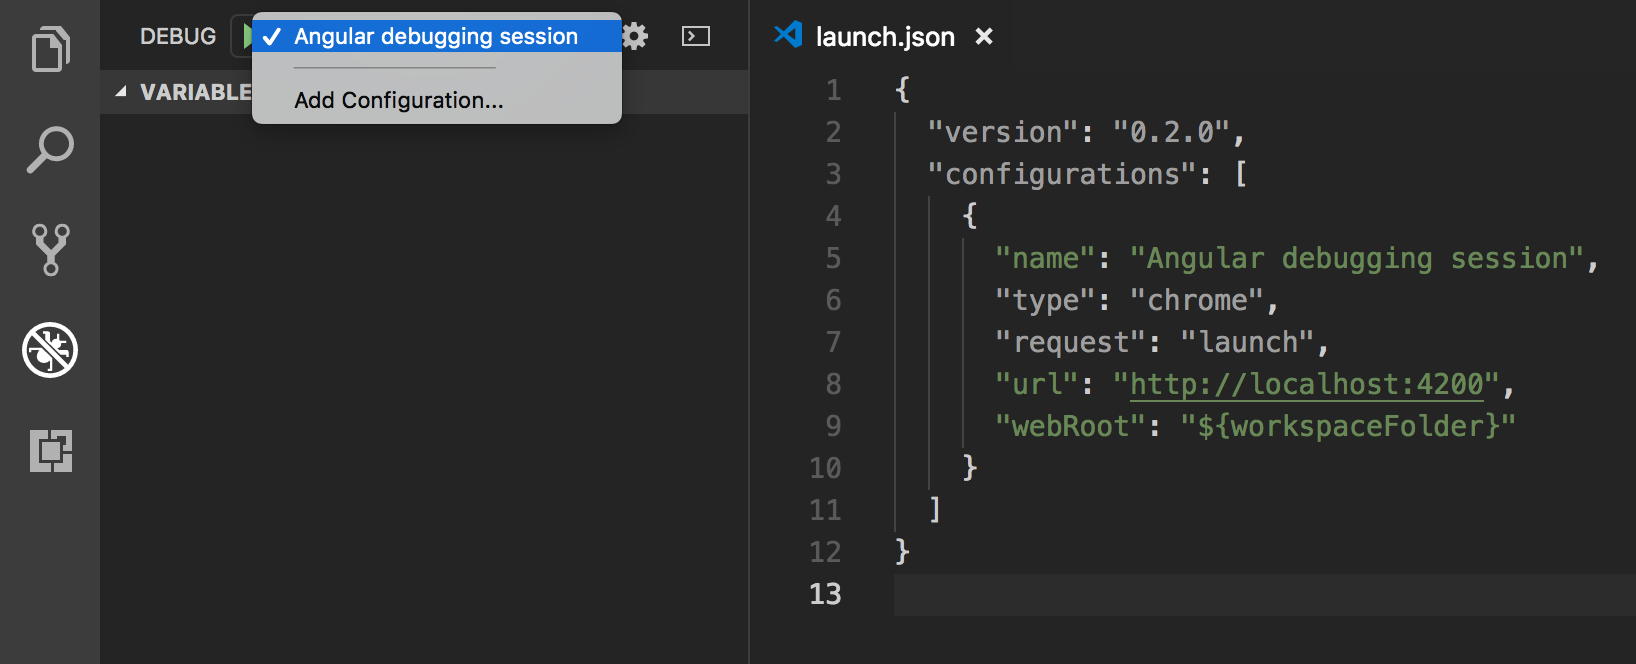
npm start- As you have webpack server running, the last step is to go to VSCode's debugger, select "Angular debugging session" configuration and run it:
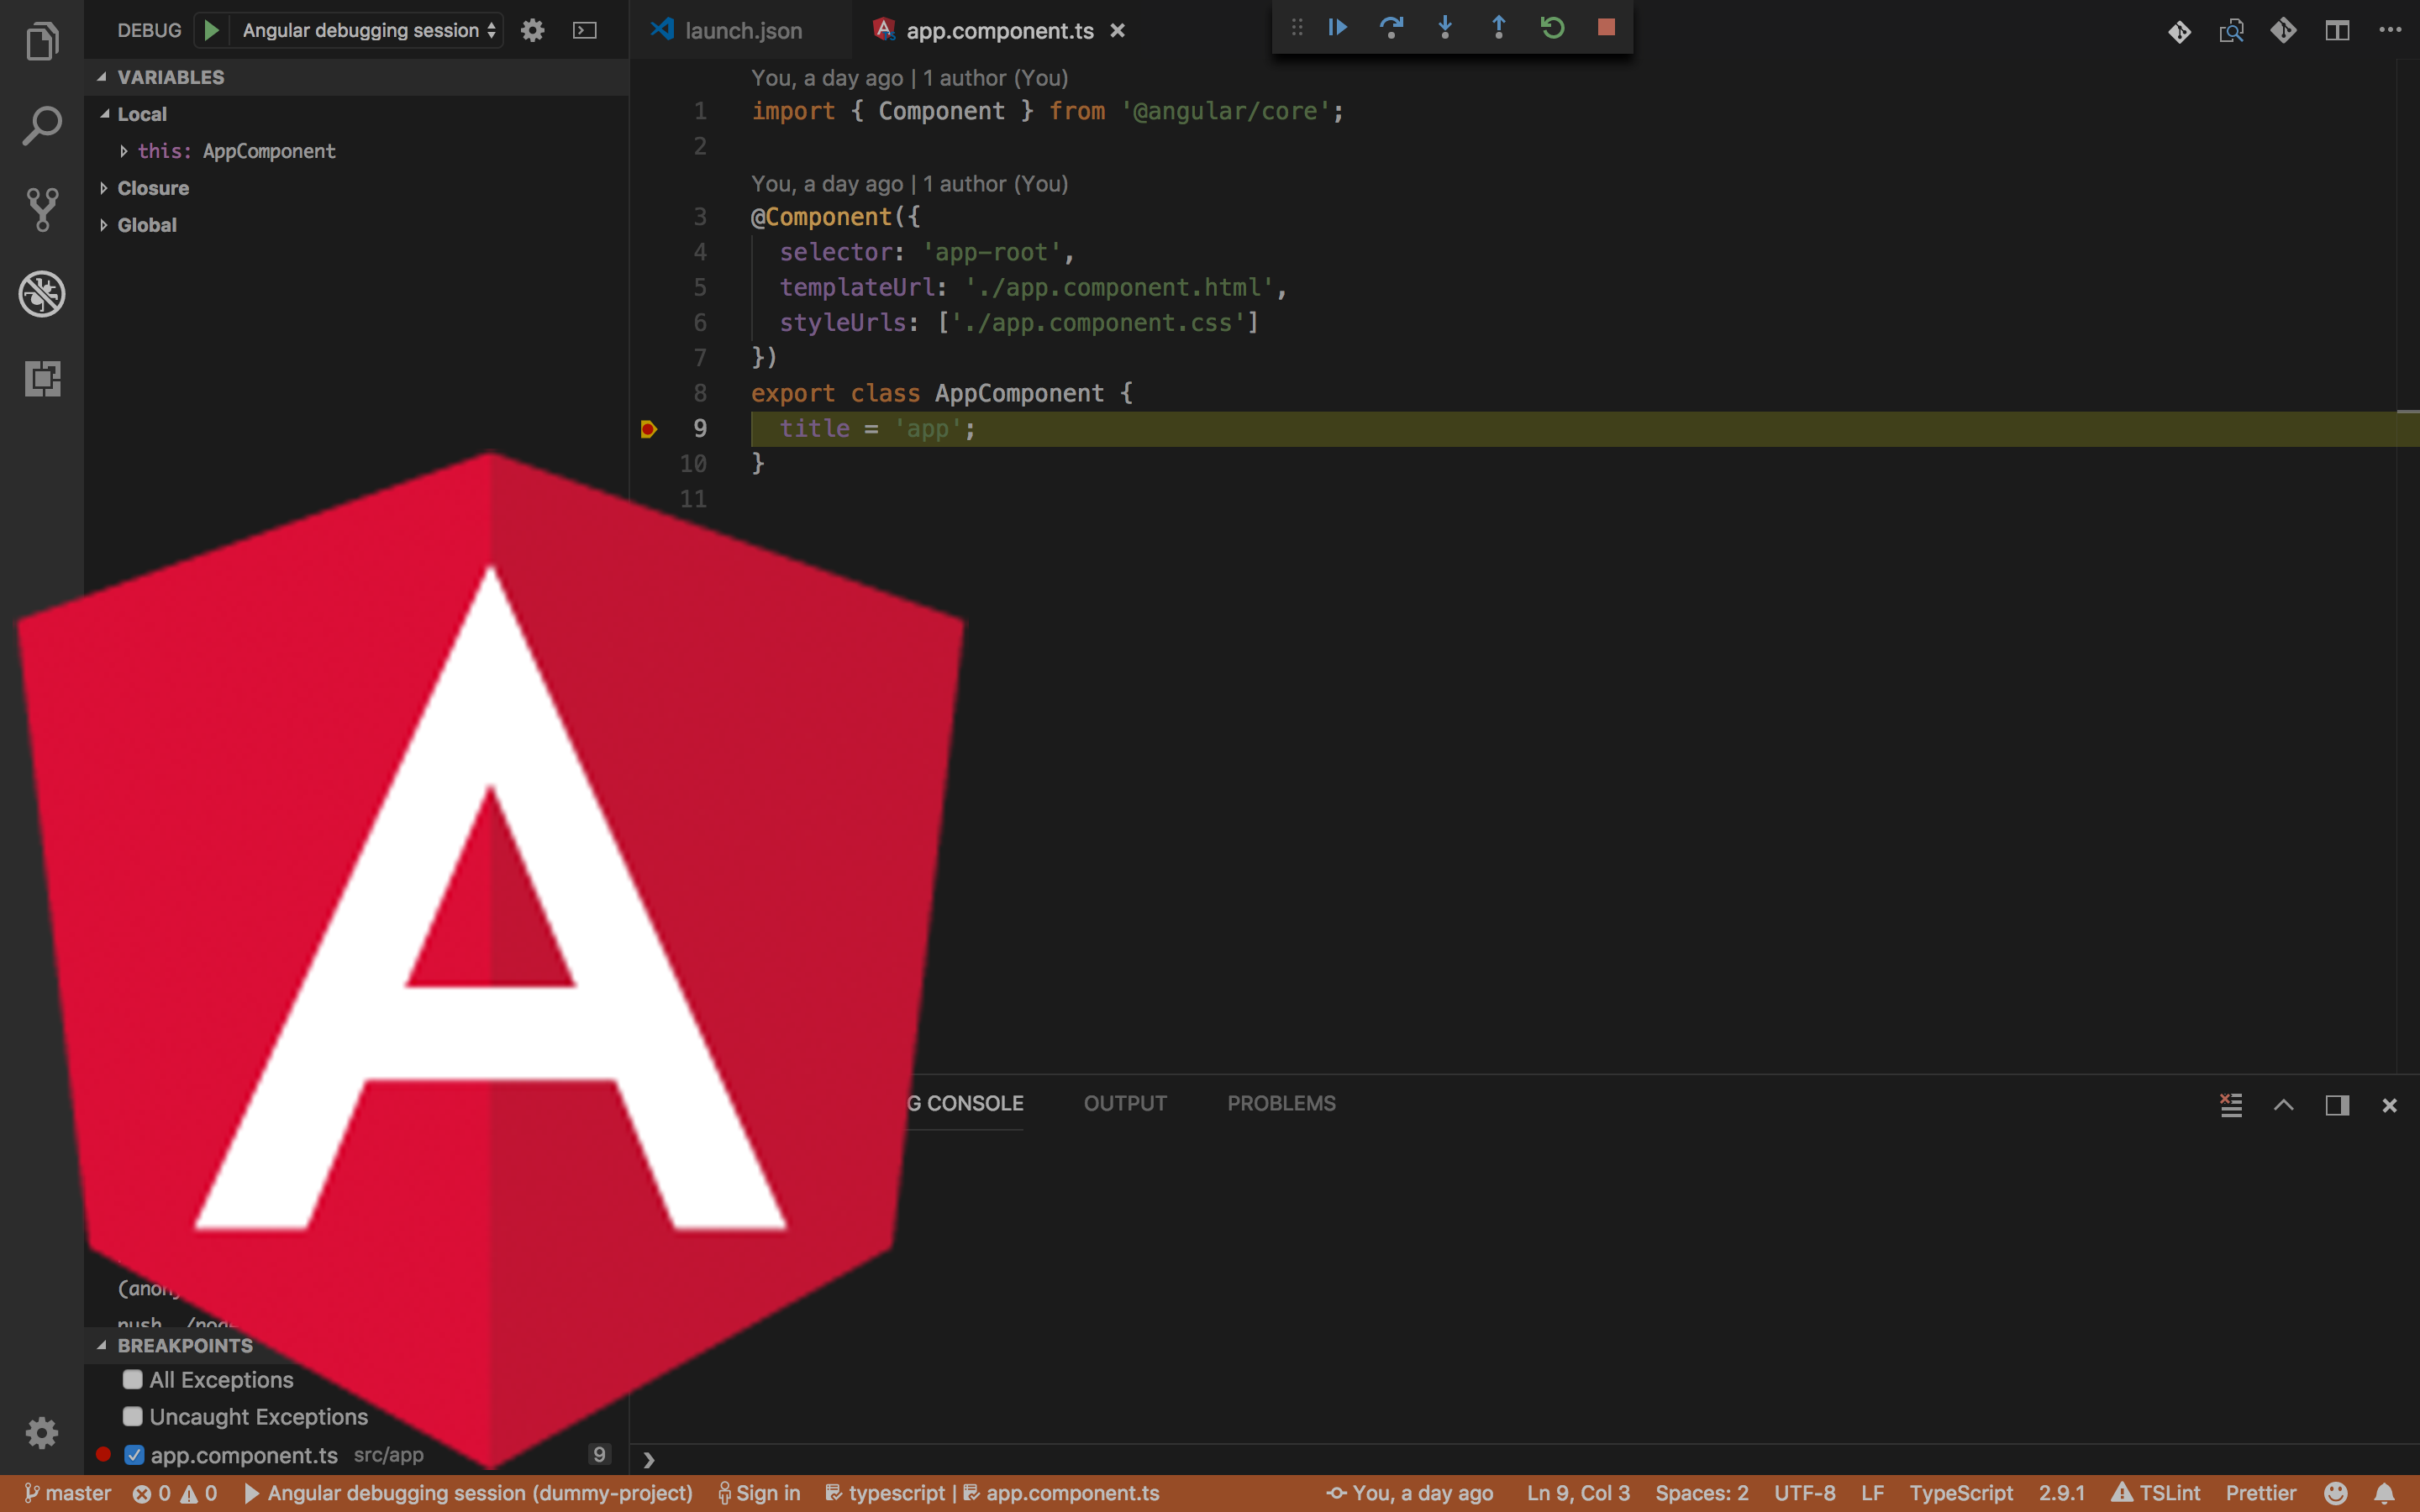
As a result of this step, new browser window should be opened. Try to set a breakpoint, refresh the browser and see the result:
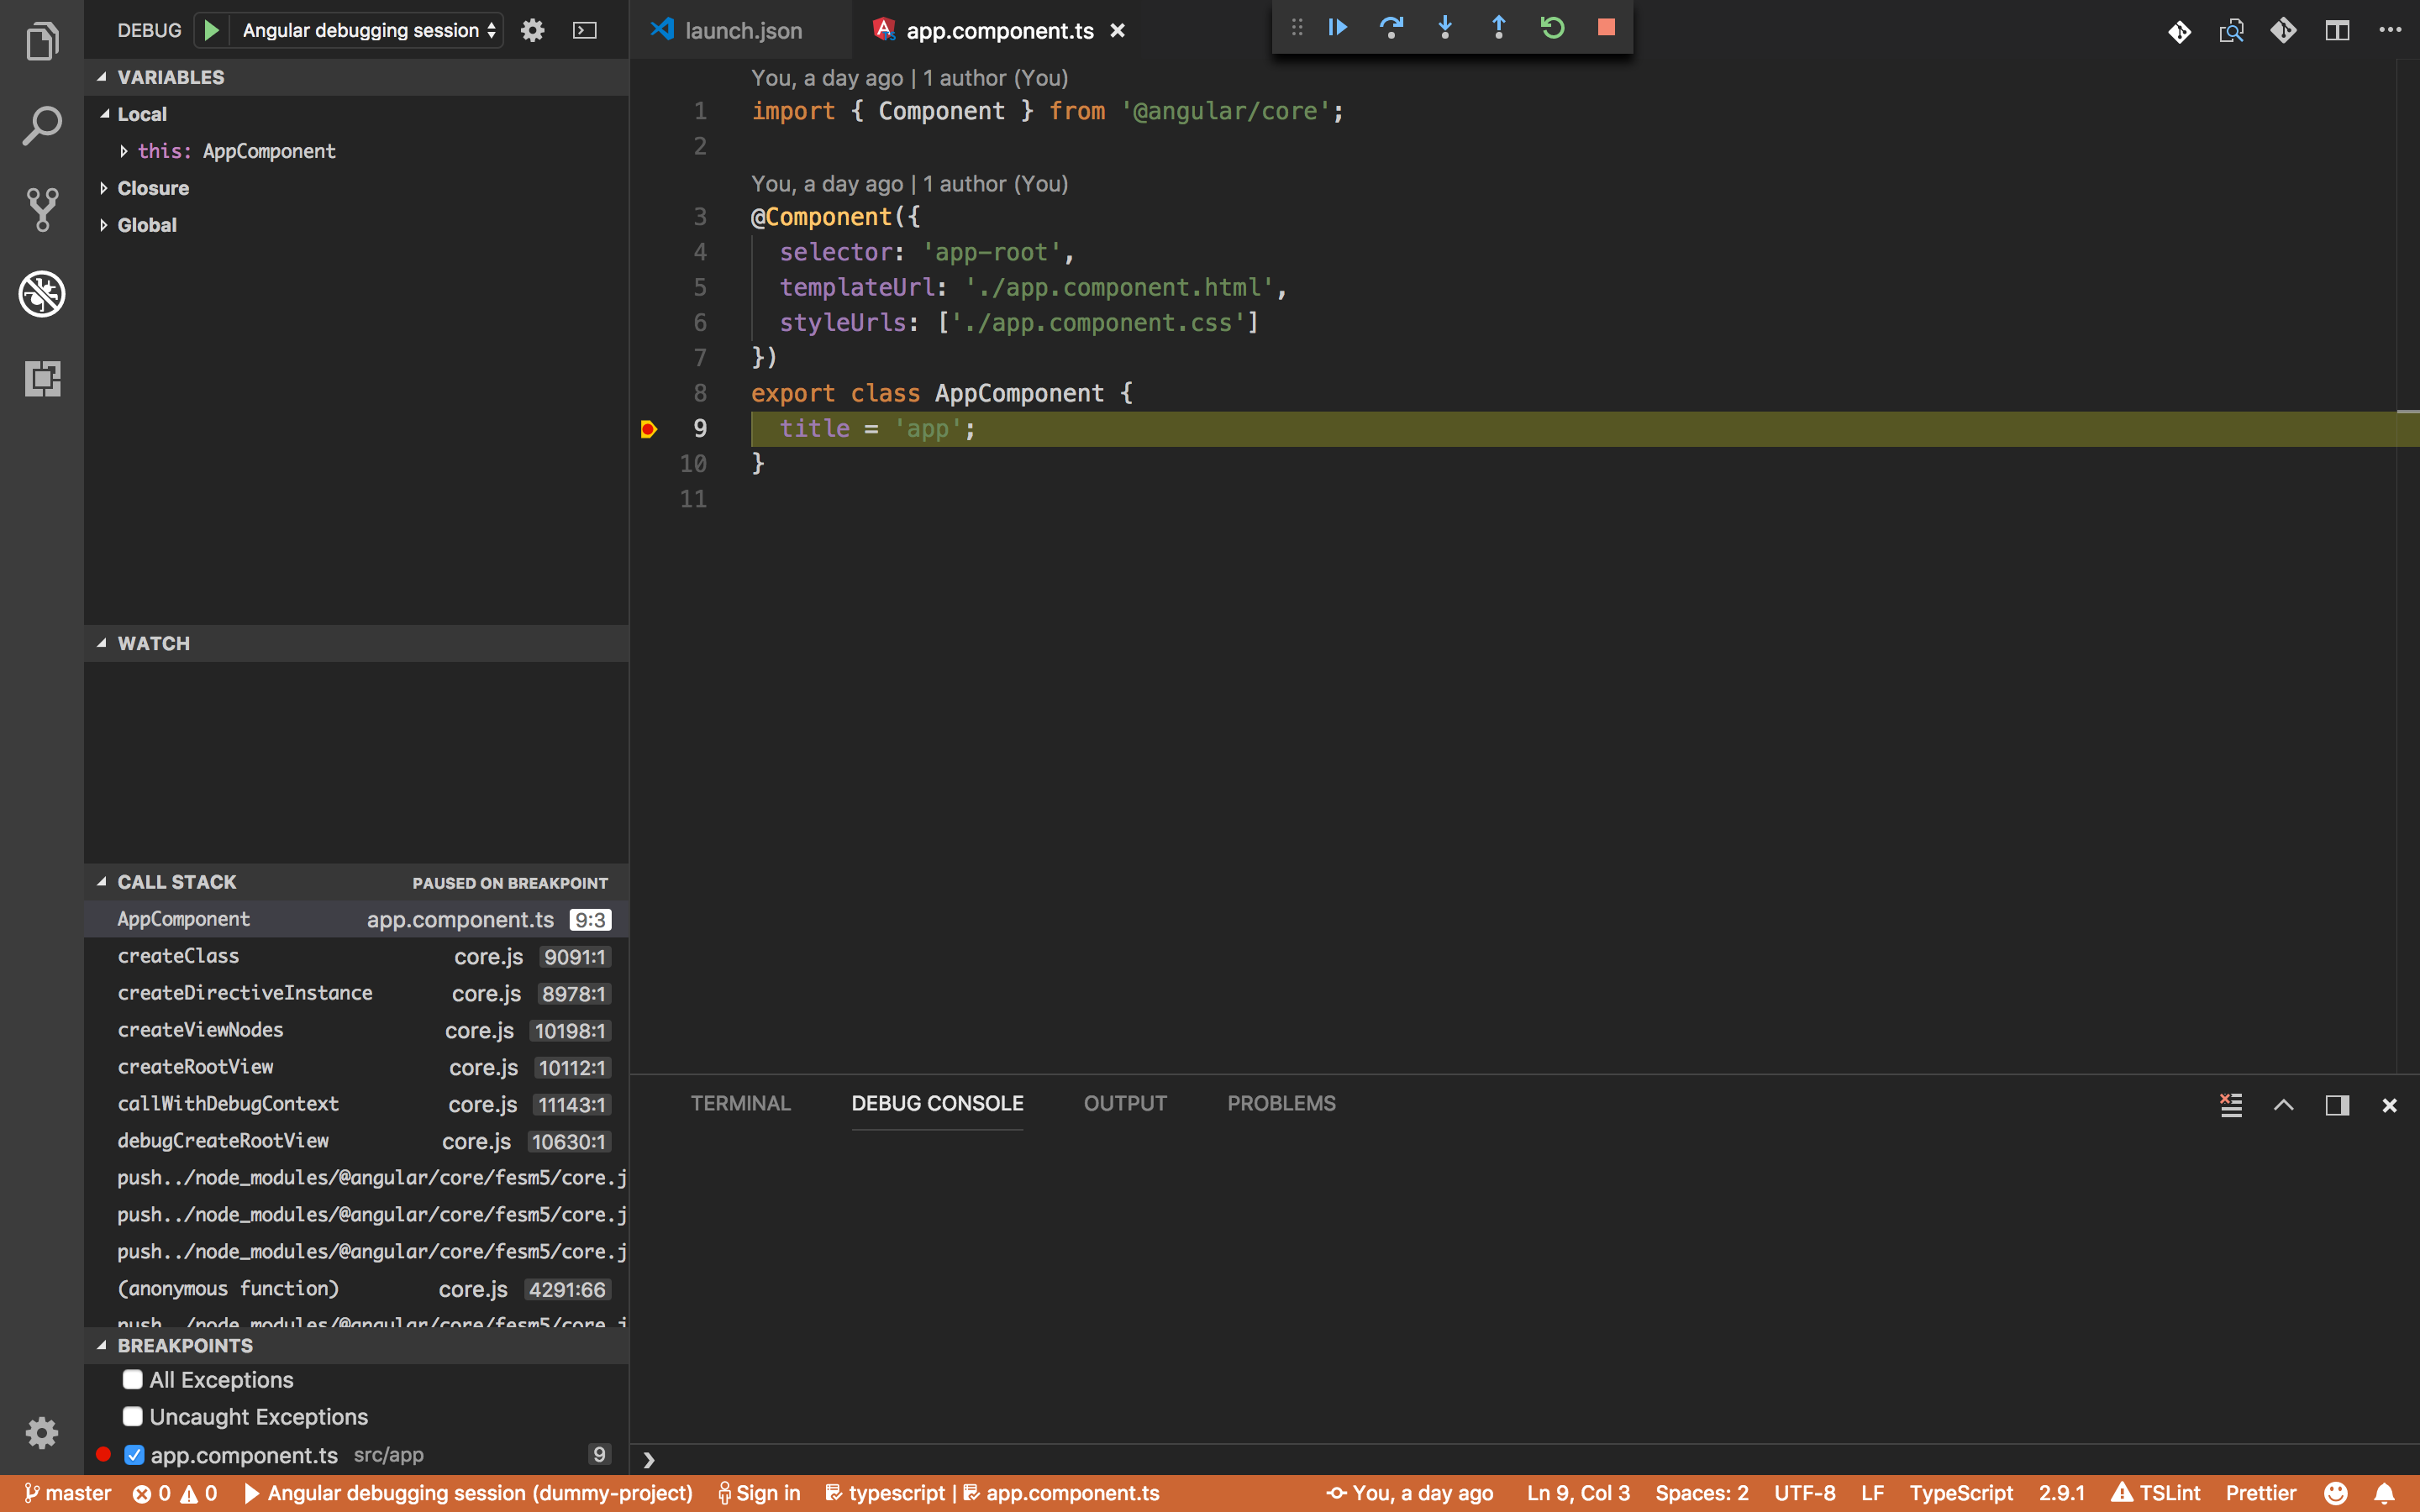
The key point here is to have web server and VSCode debugger running at the same time.
Attach to the existing process
If you don't like the option with a new browser window, you can
attach debugger to the existing browser process. In this case, Chrome
needs to be run with the exposed port. For our example, it will be port
9222.
- To run Chrome with opened debugging port, please run one of the following commands:
/Applications/Google\ Chrome.app/Contents/MacOS/Google\ Chrome --remote-debugging-port=9222or in a silent mode ( run it as a background process without output to the console):
nohup /Applications/Google\ Chrome.app/Contents/MacOS/Google\ Chrome --remote-debugging-port=9222 &launch.jsonconfiguration for VSCode will look a little bit differently. Change it in accordance with the code below:
{
  "version": "0.2.0",
  "configurations": [
    {
      "name": "Chrome Attach",
      "type": "chrome",
      "request": "attach",
      "port": 9222,
      "url": "http://localhost:4200/",
      "webRoot": "${workspaceFolder}"
    }
  ]
}- Run web server:
npm start - Select "Chrome Attach" configuration and run it. As a result of this step, new browser window should be opened. Try to set a breakpoint, refresh the browser and see the result:
As you can see, debugger icon has changed from red square to red square with an outlet, which indicates that we successfully attached debugger to Chrome's process.